Overview
The Representative Timestep Selector plugin analyzes a PCM (DCUCOPF) or QuasiDynamic ACPF scenario and identifies representative timesteps based on system states. It uses metric-based clustering to group similar timesteps together, helping users reduce large time-series scenarios to a smaller set of representative periods for more efficient analysis.
Version Compatible with SAInt 3.9
- v0.1.5 (206 MB)
Versions Compatible with SAInt 3.8
- v0.1.2
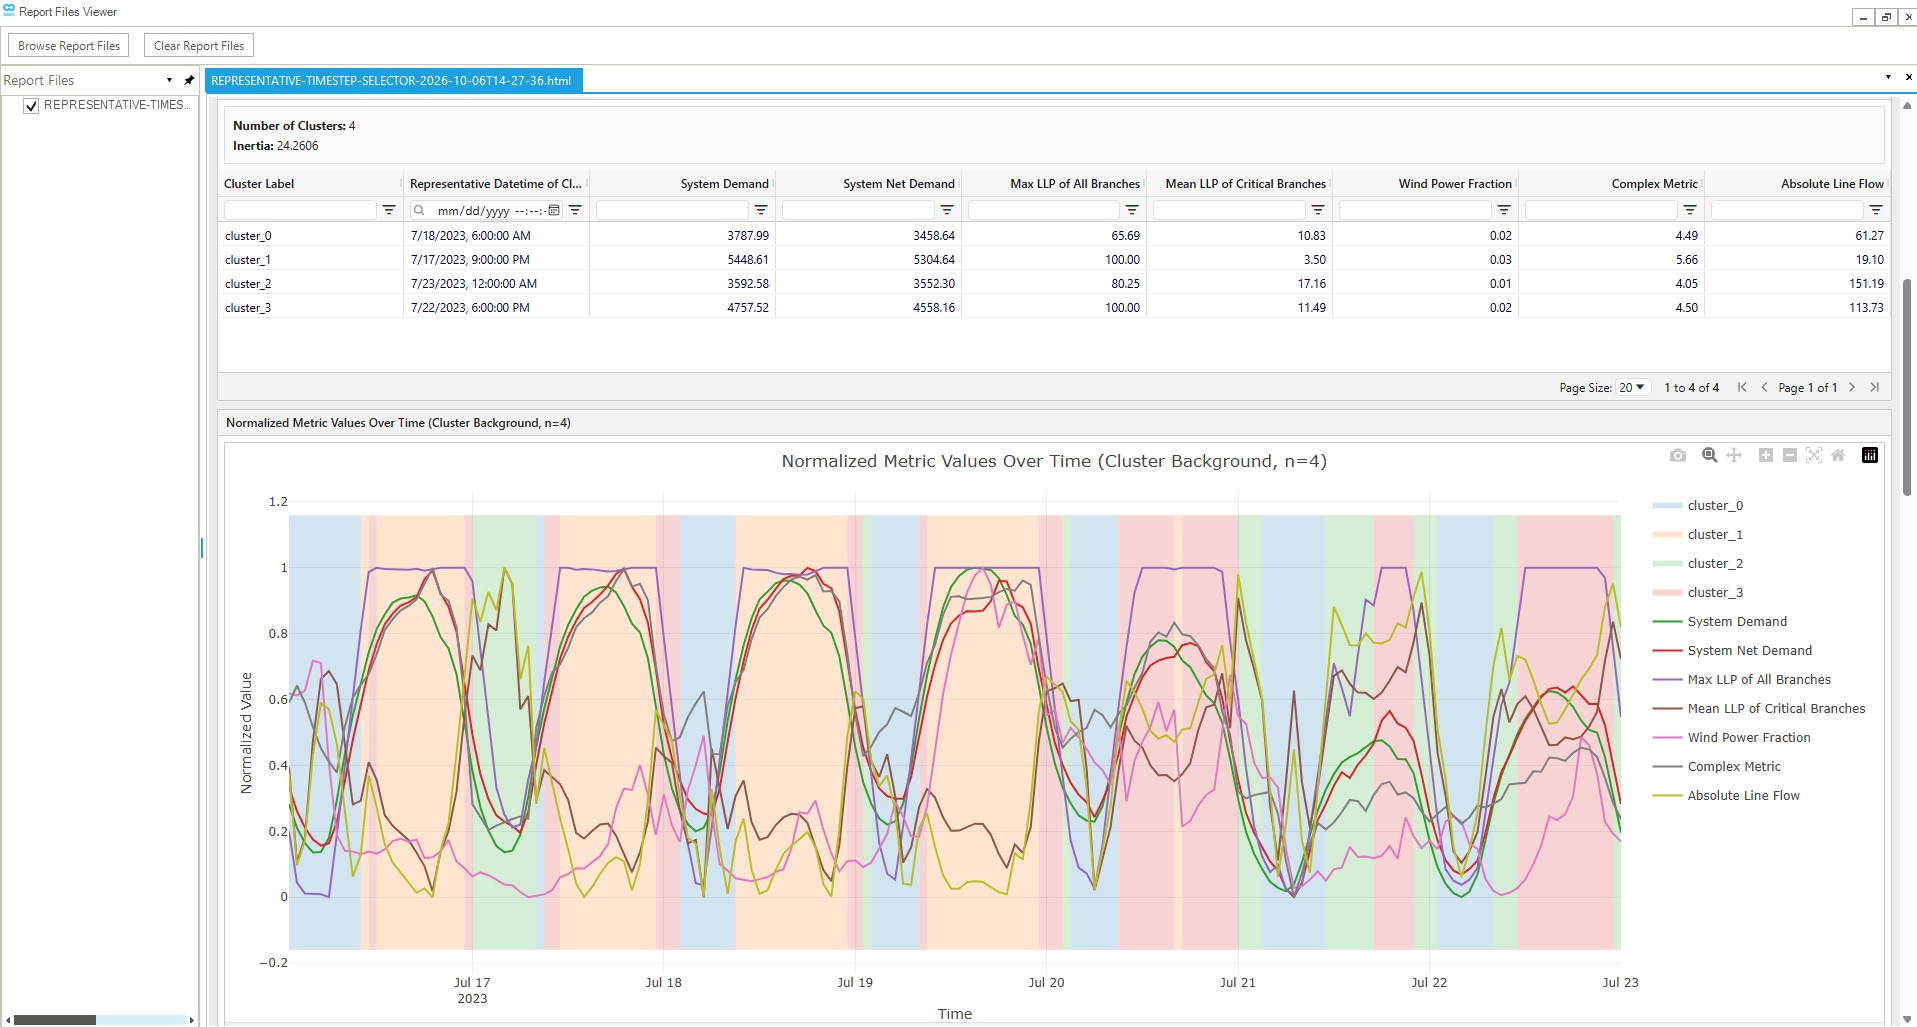
Screenshot:
Inputs
General
SAInt Network File (.enet): The SAInt electric network file containing the network topology and components.
SAInt Scenario File (.esce): The SAInt scenario file containing the PCM (DCUCOPF) or QuasiDynamic ACPF simulation data with time-series information.
Configuration File (.yaml): A YAML file defining the metrics to calculate for each timestep and optionally specifying a selection method (e.g., clustering) for identifying representative timesteps. Metrics are used to characterize system states and group similar timesteps together. See the Configuration File Format section for details on the file format.
Advanced
Copy Network And Scenario: Whether to copy the network (.enet) and scenario (.esce) files to the output directory. When set to False, the plugin uses the original file paths while still generating the results JSON and HTML report in the output folder. This can be useful when working with large files or when you only need the analysis results. Defaults to True.
SAInt API DLL Path: Path to the SAInt API DLL file. Default: C:\Program Files\encoord\SAInt-v3\SAInt-API.dll
Output Directory: The folder where the results will be saved. The plugin will:
- Optionally copy the network and scenario files to this location
- Generate a results JSON file containing all metric data and clustering results
- Generate a self-contained HTML report with visualizations
Logging Level: Controls the verbosity of logging output. Options: Debug, Info, Warning, Error, Critical
Drop Initial Timestep: Whether to exclude the initial timestep from metric calculations and clustering. This is useful when the initial timestep contains initialization artifacts or incomplete data. Defaults to True.
Note: The plugin automatically filters out timesteps with undefined values (NaN or inf) from all metrics after dropping the initial timestep. This ensures that metrics remain aligned and that undefined values (such as those produced by division by zero) do not affect normalization or clustering. Timesteps are removed if ANY metric has an undefined value at that timestep.
Results Filename: Base filename for the results JSON file without the .json extension. Defaults to results.
Report Filename: Optional base filename for the HTML report without the .html extension. When empty, the output folder name is used.
Note: Clustering settings (including the number of clusters to evaluate) are configured in the Configuration File via the optional selection_method section. See the Configuration File Format section for details.
Configuration File Format
The configuration file is a YAML file that defines what metrics to calculate for each timestep and optionally specifies a selection method (e.g., clustering) for identifying representative timesteps. Metrics are computed from SAInt object properties using an expression tree format that supports arithmetic operations, aggregations, and references to object properties.
File Format
The YAML file must contain a metrics key with a list of metric specifications. Optionally, it may also contain a selection_method key to specify how representative timesteps should be selected. Each metric has a name and an expr (expression) that defines how to calculate the metric value.
Selection Method (Optional): If provided, specifies how to select representative timesteps. Currently, only clustering is supported. If omitted, only metrics are computed without any timestep selection.
The selection_method section has the following structure:
selection_method:
  type: clustering
  params:
    n_clusters: [1, 2, 3, 4, 5, 6, 7, 8, 9]
- type (required): The type of selection method. Currently only
"clustering"is supported. - params (required): Parameters specific to the selection method type.
- For
clusteringtype:- n_clusters (required): A list of integers specifying the number of clusters to evaluate (e.g.,
[1, 2, 3, 4, 5]). The plugin will perform clustering for each specified number of clusters, allowing you to compare different granularities.
- n_clusters (required): A list of integers specifying the number of clusters to evaluate (e.g.,
- For
Metrics Section: The metrics key contains a list of metric specifications.
Here is a complete example configuration file showing both the optional selection_method and the required metrics sections:
# Optional selection method - if omitted, only metrics are computed
selection_method:
  type: clustering
  params:
    n_clusters: [1, 2, 3, 4, 5, 6, 7, 8, 9]

metrics:
  - name: "System Demand"
    expr:
      ref:
        object_type: "ENET"
        object_property: "PD"

  - name: "System Net Demand"
    expr:
      op: sub
      args:
        - op: sub
          args:
            - ref:
                object_type: "ENET"
                object_property: "PD"
            - ref:
                object_type: "ENET"
                object_property: "PPV"
        - ref:
            object_type: "ENET"
            object_property: "PWIND"

  - name: "Max LLP of All Branches"
    expr:
      op: max
      args:
        - select:
            object_type: "LI"
            object_name: "%"
            object_property: "LLP"

  - name: "Mean LLP of Critical Branches"
    expr:
      op: mean
      args:
        - ref:
            object_type: "LI"
            object_name: "ALBANY_NY_TO_GREENFIELD_MA"
            object_property: "LLP"
        - ref:
            object_type: "LI"
            object_name: "ALBANY_NY_TO_KINGSTON_NY"
            object_property: "LLP"
        - ref:
            object_type: "LI"
            object_name: "DANBURY_CT_TO_KINGSTON_NY"
            object_property: "LLP"

  - name: "Wind Power Fraction"
    expr:
      op: div
      args:
        - ref:
            object_type: "ENET"
            object_property: "PWIND"
        - ref:
            object_type: "ENET"
            object_property: "PD"

  - name: "Complex Metric"
    expr:
      op: div
      args:
        - op: add
          args:
            - op: sub
              args:
                - ref:
                    object_type: "ENET"
                    object_property: "PD"
                - ref:
                    object_type: "ENET"
                    object_property: "PPV"
            - op: mul
              args:
                - const: 1.5
                - op: sum
                  args:
                    - ref:
                        object_type: "LI"
                        object_name: "ALBANY_NY_TO_GREENFIELD_MA"
                        object_property: "LLP"
                    - ref:
                        object_type: "LI"
                        object_name: "ALBANY_NY_TO_KINGSTON_NY"
                        object_property: "LLP"
        - op: add
          args:
            - op: sum
              args:
                - select:
                    object_type: "LI"
                    object_name: "%"
                    object_property: "LLP"
            - const: 1.0
Expression Types
Metrics are defined using an expression tree composed of the following expression types:
ref - Reference to Single Object Property
References a single object property, returning a 1D time series (one value per timestep).
ref:
  object_type: "ENET"        # Required: Object type (e.g., "ENET", "LI", "GEN", "ENO")
  object_property: "PD"       # Required: Property name (e.g., "PD", "PPV", "LLP", "VPU")
  object_name: "ALBANY_NY"    # Optional: Specific object name, or omit for default object
- object_type (required): The type of SAInt object (e.g., “ENET”, “LI”, “GEN”, “ENO”)
- object_property (required): The property of the object to query (e.g., “PD”, “PPV”, “LLP”, “PWIND”, “VPU”)
- object_name (optional): The name of a specific object. If omitted, references the default object of that type (e.g., “ENET” for network-level properties)
select - Select Multiple Entities
Selects multiple entities using a wildcard pattern, returning 2D data (timesteps × entities). Must be used inside an aggregation operation (min, max, sum, mean, or median).
select:
  object_type: "LI"           # Required: Object type
  object_name: "%"            # Required: "%" for all objects (wildcard)
  object_property: "LLP"      # Required: Property name
- object_type (required): The type of SAInt object (e.g., “LI”, “ENO”)
- object_name (required): Must be “%” to select all objects of the specified type
- object_property (required): The property to query from all selected objects
op - Operation Expression
Performs arithmetic operations or aggregations on one or more expressions.
Arithmetic Operations:
add: Element-wise addition of two or more expressions (all must be 1D)sub: Element-wise subtraction (requires exactly 2 arguments, both 1D)mul: Element-wise multiplication of two or more expressions (all must be 1D)div: Element-wise division (requires exactly 2 arguments, both 1D). Division by zero produces NaN or inf values, which are automatically filtered out during preprocessing (see Metric Calculation Process)abs: Absolute value (requires exactly 1 argument, must be 1D)
Aggregation Operations:
min: Minimum value across arguments (can aggregate 2D data fromselectacross entities)max: Maximum value across arguments (can aggregate 2D data fromselectacross entities)sum: Sum across arguments (can aggregate 2D data fromselectacross entities)mean: Mean value across arguments (can aggregate 2D data fromselectacross entities)median: Median value across arguments (can aggregate 2D data fromselectacross entities)
op: sub                    # Operation type
args:                      # List of expression arguments
  - ref: {...}             # First argument
  - ref: {...}             # Second argument
const - Constant Value
A constant numeric value that is applied to all timesteps.
const: 1.5 # Constant numeric value
Metric Calculation Process
For each timestep, the plugin evaluates the metric expression tree:
- Parse Expression Tree: The plugin parses the YAML expression tree into an internal representation
- Recursively Evaluate Expressions: Starting from the root expression, the plugin recursively evaluates:
refexpressions: Queries the SAInt API for the specified object property, returning a 1D time seriesselectexpressions: Queries the SAInt API for all matching objects, returning 2D data (timesteps × entities)opexpressions: Applies the specified operation to the evaluated arguments- Arithmetic operations (
add,sub,mul,div) combine 1D time series element-wise- Note: Division operations (
div) that encounter zero denominators produce NaN or inf values instead of failing. These undefined values are automatically filtered out in the preprocessing step.
- Note: Division operations (
- Aggregation operations (
min,max,sum,mean,median) can aggregate 2D data across entities (fromselect) or combine multiple 1D time series
- Arithmetic operations (
constexpressions: Returns an array filled with the constant value
- Preprocess Metric Data: The plugin applies preprocessing steps to clean the data:
- Drop Initial Timestep (if enabled): Removes the first timestep, which often contains initialization artifacts
- Drop Undefined Timesteps: Removes any timesteps where ANY metric has undefined values (NaN or inf). This ensures all metrics remain aligned with the same timesteps after filtering.
- Normalize Values: Applies min-max normalization across all timesteps to scale values between 0 and 1
The normalized metric values are then used for clustering, ensuring that metrics with different scales contribute equally to the clustering process.
Computation Logic
The representative timestep selection process follows these steps:
1. Load and Validate Configuration
The plugin loads the configuration from the YAML file, which includes:
- Metric specifications: List of metrics to calculate
- Selection method (optional): Configuration for how to select representative timesteps (e.g., clustering parameters)
The plugin validates the configuration:
- Ensures all required fields are present
- Validates metric expression trees (operation types, argument counts, etc.)
- Validates selection method configuration if provided
- Reports validation errors for any invalid specifications
2. Extract Scenario Time Information
The plugin extracts the scenario’s time range and time step:
- Start datetime
- End datetime
- Time step duration (in seconds)
This information is used to generate the list of timesteps for metric calculation.
3. Calculate Metrics
For each valid metric specification, the plugin:
- Recursively evaluates the expression tree, starting from the root expression
- For
refexpressions: Queries the SAInt API for the specified object property (returns 1D time series) - For
selectexpressions: Queries the SAInt API for all matching objects (returns 2D data: timesteps × entities) - For
opexpressions: Applies the specified operation (arithmetic or aggregation) to the evaluated arguments- Division operations: If a division encounters a zero denominator, it produces NaN or inf values instead of failing. These undefined values are handled in the preprocessing step.
- For
constexpressions: Uses the constant value for all timesteps
Each metric produces a time series of values, one per timestep. Some values may be NaN or inf if division by zero occurred.
4. Preprocess Metric Data
The plugin applies preprocessing steps to clean the metric data before normalization and clustering:
-
Drop Initial Timestep (if enabled): Removes the first timestep from all metrics. This is useful when the initial timestep contains initialization artifacts or incomplete data that could skew the analysis.
-
Drop Undefined Timesteps: Removes any timesteps where ANY metric has undefined values (NaN or inf). This step:
- Identifies timesteps with undefined values across all metrics
- Removes those timesteps from ALL metrics simultaneously, maintaining alignment
- Ensures all metrics have the same timesteps after filtering
- This is particularly important for metrics involving division operations, which may produce undefined values when denominators are zero
-
Normalize Values: Applies min-max normalization across all remaining timesteps to scale values between 0 and 1
After preprocessing, each metric produces a time series of normalized values, one per timestep, with all undefined values removed.
5. Build Feature Matrix (if selection method is specified)
If a selection method (e.g., clustering) is configured, the plugin constructs a feature matrix where:
- Rows represent timesteps
- Columns represent metrics
- Values are the normalized metric values
This matrix is used as input to the selection algorithm.
6. Perform Selection Method (if configured)
If a selection_method is specified in the configuration file, the plugin performs the selection process. Currently, only clustering is supported:
Clustering Selection Method:
The plugin performs K-means clustering on the feature matrix for each specified number of clusters:
- Feature Matrix Construction: All normalized metric values are combined into a single feature matrix
- K-means Clustering: For each cluster count specified in
n_clusters(e.g., [2, 3, 4, 5]), the plugin:- Applies K-means clustering with a fixed random seed (1008) for reproducibility
- Groups timesteps into clusters based on similarity of their metric values
- Calculates cluster inertia (sum of squared distances from points to their cluster centers)
- Centroid Selection: For each cluster, the plugin identifies the actual timestep closest to the cluster center as the representative timestep (centroid)
The clustering process is performed once for each cluster count, allowing comparison of different granularities.
Note: If no selection_method is specified in the configuration file, the plugin skips this step and only computes metrics without performing any timestep selection.
7. Generate Results
The plugin generates comprehensive results including:
- Metric Data: All calculated metrics with their values and normalized values for each timestep
- Selection Results (if selection method was configured): For clustering, this includes results for each cluster configuration:
- Cluster assignments for each timestep
- Representative timesteps (centroids) for each cluster
- Cluster inertia values
- Validation Errors: Any metric specifications that failed validation
- Configuration: The metric specifications and selection method configuration that were used
Output
The plugin generates the following outputs in the specified output directory:
1. Results JSON File (results.json by default)
A comprehensive JSON file containing:
- All metric data with values and normalized values for each timestep
- Selection results (if selection method was configured): For clustering, this includes results for each cluster configuration:
- Cluster assignments (which timesteps belong to which cluster)
- Representative timesteps (centroids) for each cluster
- Cluster inertia values
- Metric specifications that were used
- Selection method configuration that was used (if any)
- Validation errors for any invalid specifications
This file can be used for programmatic access to the results or further analysis.
2. HTML Report (<output_folder_name>.html by default)
An interactive HTML report containing:
-
Metric Visualizations:
- Time series plots showing normalized metric values over time
- All metrics plotted together for easy comparison
-
Cluster Analysis (if selection method was configured):
- Inertia vs. Number of Clusters plot to help select the optimal number of clusters
- Tabbed interface showing cluster results for each cluster configuration
- For each cluster configuration:
- Cluster assignments visualized on metric plots with background shading
- Representative timesteps (centroids) highlighted
- Cluster statistics and member counts
- Pairplot Matrix: A scatter plot matrix showing relationships between all pairs of metrics, with points colored by cluster assignment. This visualization helps understand how clusters group timesteps in the multi-dimensional metric space and reveals correlations between different metrics.
-
Metric Specifications Table:
- Summary of all metric specifications used
- Expression trees showing the structure of each metric calculation
-
Validation Errors Table:
- Any metric specifications that failed validation
- Error messages explaining what went wrong
The HTML report provides a comprehensive visual analysis of the representative timestep selection process, making it easy to understand which timesteps were selected and why.
3. Copied Network and Scenario Files (Optional)
If “Copy Network and Scenario” is set to True (the default), the original network and scenario files are copied to the output directory for reference and further analysis. If set to False, the files are not copied, and the plugin uses the original file paths directly.
Interpreting Results
Selecting the Number of Clusters
If a clustering selection method was configured, the plugin generates results for multiple cluster configurations. To select the optimal number:
-
Review the Inertia Plot: The inertia (within-cluster sum of squares) generally decreases as the number of clusters increases. Look for an “elbow” in the curve where adding more clusters provides diminishing returns.
-
Examine Cluster Assignments: Review the cluster assignments in the HTML report to see how timesteps are grouped. Ensure the clusters make physical sense for your analysis.
Representative Timesteps
For each cluster, the plugin identifies a representative timestep (centroid) that is the actual timestep closest to the cluster center. This timestep:
- Represents the typical system state for that cluster
- Can be used as a single representative period for that cluster
- Contains the actual datetime and SAInt hour index for easy reference
Changelog
v0.1.5
- SAInt 3.9 compatibility: Updated DLL compatibility checks and scenario timestep retrieval for the SAInt 3.9 API.
- Report and UI updates: Standardized plugin form and CLI argument names, added configurable result/report filenames, and improved the HTML report with expandable metric details, CSV export, and responsive pairplots.
- Metric table fix: Fixed report tables so metric names containing periods display their values correctly instead of showing null cells.
- Release process updates: Aligned local and CI packaging with the current plugin release requirements, including the PowerShell build script, tag-driven build artifacts, signing support, and release pipeline publishing updates.
v0.1.2
- Initial public release: Added representative timestep selection for SAInt PCM (DCUCOPF) and QuasiDynamic ACPF scenarios.
- K-means clustering: Added clustering-based representative timestep selection, with support for computing metrics without specifying a selection method.
- Configurable metrics: Added YAML metric configuration using expression trees, including arithmetic operations (
add,sub,mul,div,abs), aggregation operations (min,max,sum,mean,median), andselectexpressions for querying multiple entities with wildcard patterns. - Flexible outputs: Added JSON results with metric and clustering data, HTML report generation with metric visualizations and cluster analysis, and an option to skip copying network and scenario files to the output directory.