From my Log window, I found my model is curtailing demand and ancillary service (EDEM.ENS and ASVC.ENS). I used nplot(EDEM.D1.PNS) command to see the curtailed demand. I am wondering is there any iron python script or command for seeing the PNS plot for curtailed ancillary service. In my case it was UP reserve.
As far I understand, valcurt will show total curtailment. I specifically want to see in plot when this curtailment happening similar to demand curtailment using PNS.
I think we are misunderstanding one another. Perhaps the description of the ValCurt property in the documentation: “Total curtailment of service requirement” is misleading.
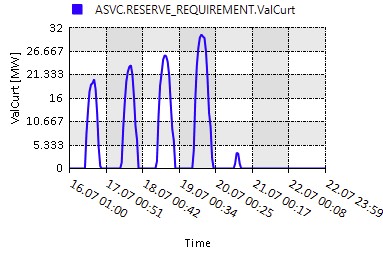
I used the command nplot("ASVC.RESERVE_REQUIREMENT.ValCurt") to generate the following plot:
Can you confirm if this is the behavior you are looking for? If so, I can discuss with the team regarding our description of the ValCurt property in the documentation.
Thank you so much. Yes the ASVC object description for ValCurt “Total curtailment of service requirement” was misleading. However, your plot line with ValCurt solves my problem. Now I see when my UP reserve got curtailed.