The ENET138 network is a modified version of the IEEE 123-bus Test System combined with a subtransmission system, laid out over Brattleboro, Vermont.
Download it here: ENET138 v24.10.2.zip (5.3 MB)
Disclaimer
The ENET138 dataset is an adaptation of the IEEE-123 distribution test system, enhanced with a sub-transmission network. However, it is not a technically rigorous representation of the IEEE-123 system, as few components have been changed. The names of nodes and generators are purely illustrative. Transmission line voltage ratings and capacities are set for demonstration purposes only. The sub-transmission network is entirely fictional, created based on internal expertise.
This model, developed by encoord GmbH for the Scenario Analysis Interface for Energy Systems (SAInt) planning software, is provided “as is” at no cost. encoord GmbH disclaims all responsibility for its use by others and makes no warranties, express or implied, regarding its quality, reliability, safety, or suitability. encoord GmbH will not be liable for any direct, indirect, or consequential damages related to its use.
Overview
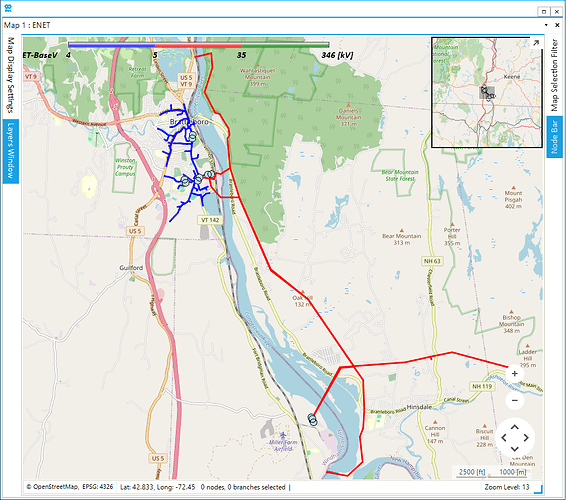
The ENET138 network combines a 34.5 kV sub-transmission system with a modified 4.16 kV IEEE-123 distribution network, as shown in Figure 1. Table 1 below provides an overview of the components that make up the ENET138 network’s topology.
| SAInt Object Type | Representative Object | Count |
|---|---|---|
| ENO | Nodes (Buses) | 138 |
| LI | Electric Lines | 132 |
| TRF | Transformers | 6 |
The sub-transmission system uses a 34.5 kV ground Wye conductor path with varying demands across its primarily radial structure. The distribution network is connected on the low-voltage side of the 34.5 kV/4.16 kV substation transformer.
The ENET138 network contains 109 demand objects (SAInt Object: EDEM), with a total peak power demand of 5.3 MW. The generation fleet includes 17 distributed PV systems (SAInt Object: PV) installed at various nodes in the distribution network, as described in Distributed PV Generators. Additionally, there is one generic generator (SAInt Object Type: XGEN) located in the sub-transmission network.
Developing the ENET138 Network: A Modified Version of the IEEE-123 Test System
In SAInt, a network is a directed graph comprising objects such as nodes, branches, and externals. These objects are interconnected and may be supplemented by auxiliary objects that represent or facilitate connections between them. Each network is characterized by its geometric, topological, relational, and static properties of all its objects.
The ENET138 network builds on the foundation of the IEEE-123 test system. The following sections explain the key expansions made to the network.
Sub-Transmission System
The ENET138 network includes a 34.5 kV sub-transmission system that connects the 4.16 kV distribution network to other regional demands and a fictitious 345 kV high-voltage network. The connection point to the high-voltage network is at node SUBT_N1 (SAInt Object Type: ENO), where a generic generator is located. This generator is configured to maintain a stable voltage and supply the necessary power to energize both the sub-transmission and distribution networks.
The sub-transmission system, shown by the red transmission lines in Figure 1, operates on a 40 MVA base at a voltage level of 34.5 kV. The transformers included in the sub-transmission network are detailed in the Transformers section, while the line impedances for the sub-transmission lines are detailed in Table 2 below.
Table 2: Sub-Transmission Line Impedances
| SAInt Object | Name | BBL | BBOL | RRL | RROL | XXL | XXOL | L [km] |
|---|---|---|---|---|---|---|---|---|
| LI | SUBT_L1 | 4 | 1.5 | 0.152 | 0.456 | 0.366 | 1.09 | 2.95 |
| LI | SUBT_L2 | 4 | 1.5 | 0.152 | 0.456 | 0.366 | 1.09 | 2.41 |
| LI | SUBT_L3 | 4 | 1.5 | 0.152 | 0.456 | 0.366 | 1.09 | 0.68 |
| LI | SUBT_L4 | 4 | 1.5 | 0.152 | 0.456 | 0.366 | 1.09 | 3.58 |
| LI | SUBT_L5 | 4 | 1.5 | 0.152 | 0.456 | 0.366 | 1.09 | 5.98 |
| LI | SUBT_L6 | 4 | 1.5 | 0.152 | 0.456 | 0.366 | 1.09 | 1.96 |
| LI | SUBT_L7 | 4 | 1.5 | 0.152 | 0.456 | 0.366 | 1.09 | 1.81 |
| LI | SUBT_L8 | 4 | 1.5 | 0.152 | 0.456 | 0.366 | 1.09 | 2.13 |
| LI | SUBT_L9 | 4 | 1.5 | 0.152 | 0.456 | 0.366 | 1.09 | 0.1 |
| LI | SUBT_L10 | 4 | 1.5 | 0.152 | 0.456 | 0.366 | 1.09 | 6.03 |
| LI | SUBT_L11 | 4 | 1.5 | 0.152 | 0.456 | 0.366 | 1.09 | 0.35 |
| LI | SUBT_L12 | 4 | 1.5 | 0.152 | 0.456 | 0.366 | 1.09 | 0.18 |
Tip
In this simplified model, the sub-transmission and distribution systems have a radial structure. For more complex sub-transmission networks with multiple high-voltage connections, users can configure additional generic generators to respond dynamically to load changes using the network’s participation factor capabilities.
Geographical Coordinates
The layout of the ENET138 sub-transmission and distribution systems is entirely fictional and does not represent any actual power infrastructure in New England. However, someelements are based on real-world locations to provide context:
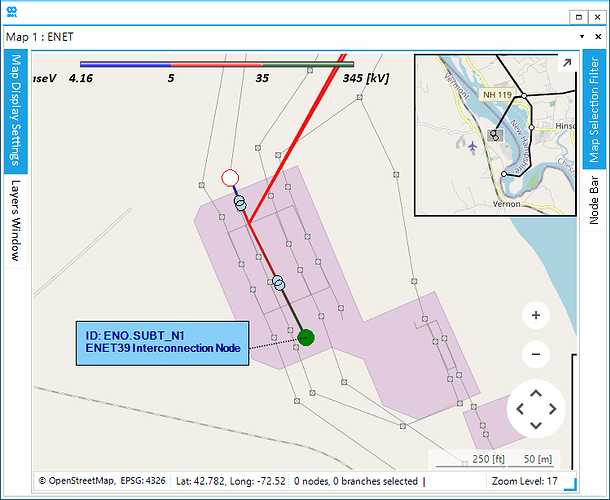
- The bulk power connection of the sub-transmission network is positioned at a real, known transmission substation, which also serves as a node in the ENET39 network. Figure 2 below shows the interconnection node in the ENET138 network that can be used to connect to the ENET39 transmission network.
- The feeder head of the distribution network is located at a real distribution substation, though all voltages and equipment used in the model are completely synthetic and created for demonstration purposes.
The distribution network is nearly identical to the standard IEEE-123 test system, but for visualization, it has been overlaid onto the town of Brattleboro, Vermont. This geographic alignment is purely illustrative—the authors do not have detailed knowledge of the actual electrical distribution system in Brattleboro, and the model does not represent any real-world data for the town.
Tip
Users familiar with the ENET39 will recognize the SUBT_N1 node as the equivalent of ENO.BRATTLEBORO_VT. In fact, users can easily combine these two networks to run integrated Transmission-Distribution simulations or optimizations.
Transformers
All transformers (SAInt Object Type: TRF) on the sub-transmission network, part of the SUBT zone (SAInt Object Type: EZN), including the step-down transformer SUBT_FEEDER_123 to the distribution network in the IEEE123 zone, have been modeled with synthetic parameters. The substation transformer SUBT_FEEDER_123, positioned at the feeder head of the distribution network, is typically equipped with a ganged load tap changer (LTC). However, in this model, it is configured with individual phase control.
The voltage regulating transformers in the IEEE123 zone, derived from the IEEE-123 test system, have been set up using the control parameters shown in Table 3 below:
Table 3: Voltage Regulating Transformers
| Name | PHASESINUSE | TAPSTEP | TAPMIN | TAPMAX | D | VMSETDEF |
|---|---|---|---|---|---|---|
| IEEE123_REG2A | A | 0.625 | -16 | 16 | 0.01 | 1.0 |
| IEEE123_REG3C | C | 0.625 | -16 | 16 | 0.01 | 1.0 |
| IEEE123_REG4ABC | ABC | 0.625 | -16 | 16 | 0.01 | 1.04 |
where:
- PHASESINUSE: Connected phase of the transformer.
- VMSETDEF: Default voltage magnitude set point in [pu] of network base.
- TAPSTEP: Tapstep in [%].
- TAPMIN: Minimum value of available tap positions.
- TAPMAX: Maximum value of available tap positions.
- D: Deadband in [pu].
Note
The delta-connected step-down transformer F1_XFM1 in the IEEE-123 test system has been removed along with the F1_610 node.
Line Lengths
Following the initial translation of the IEEE-123 test system to build the distribution network of ENET 138, and the validation of the power flow within SAInt, the network was adjusted to align with the streets of Brattleboro. To enhance the layout on the map, certain line lengths were modified. Since all lines are characterized by per-unit length impedances, these adjustments led to changes in the total line impedance values. The comparison of line lengths between ENET138 and IEEE-123 test system are provided in the Line Lengths Comparison section.
Line Impedance Matrices
For the distribution network in the IEEE123 zone, all electric lines have been modified from the IEEE-123 test system values such that the self-impedance values are identical for each phase, and the mutual impedance values are consistent for each phase pair. These adjustments are minor, typically on the order of 1%, and result in symmetric impedance matrices, allowing them to be expressed in terms of positive and zero-sequence components.
The impedance matrix for three-phase lines is written as follows:
where:
- z_s is the self-impedance of each phase.
- z_m is the mutual impedance between the phases.
From this impedance matrix, the sequence components are derived as follows:
where:
- Z_0 is the zero-sequence impedance.
- Z_1 and Z_2 are the positive and negative sequence impedances, respectively.
The self-impedance Z_s and mutual impedance Z_m are calculated using:
Demands
Table 4 below shows the aggregated quantity of demand objects per phase in the ENET138 network, along with the peak power consumption:
Table 4: Electric Demand Objects
| Phase | Zone | Count | Peak Power [MW] |
|---|---|---|---|
| A | IEEE123 | 34 | 0.040 |
| B | IEEE123 | 21 | 0.075 |
| C | IEEE123 | 26 | 0.075 |
| Wye | IEEE123 | 2 | 0.210 |
| AB | IEEE123 | 3 | 0.105 |
| Wye | SUBT | 7 | 5.3 |
Distributed PV Generators
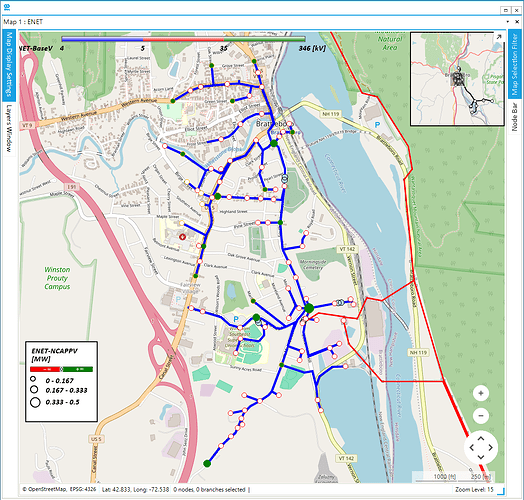
The distributed PV generators are installed at 17 nodes within the distribution network in the IEEE123 zone. The nodes with PV installations are highlighted in green, with the size of each green node circle representing the capacity of the installed PV plant, as shown in Figure 3. Table 5 lists the PV generators with information on their respective power capacities and ratings.
| Generator Name | PMAXDEF [MW] | QMAXDEF [MVAr] | QMINDEF [MVAr] | RATEDS [MVA] | Phase |
|---|---|---|---|---|---|
| IEEE123_A_1 | 0.02 | 0 | 0 | 0.06 | A |
| IEEE123_A_2 | 0.03 | 0 | 0 | 0.09 | A |
| IEEE123_A_0 | 0.01 | 0 | 0 | 0.03 | A |
| IEEE123_B_1 | 0.02 | 0 | 0 | 0.06 | B |
| IEEE123_B_2 | 0.03 | 0 | 0 | 0.09 | B |
| IEEE123_B_0 | 0.01 | 0 | 0 | 0.03 | B |
| IEEE123_C_0 | 0.01 | 0 | 0 | 0.03 | C |
| IEEE123_C_2 | 0.03 | 0 | 0 | 0.09 | C |
| IEEE123_C_1 | 0.02 | 0 | 0 | 0.06 | C |
| IEEE123_ABC_0 | 0.10 | 0.03 | -0.03 | 0.12 | ABC |
| IEEE123_ABC_6 | 0.25 | 0.05 | -0.05 | 0.25 | ABC |
| IEEE123_ABC_5 | 0.20 | 0.05 | -0.05 | 0.25 | ABC |
| IEEE123_ABC_3 | 0.20 | 0.05 | -0.05 | 0.25 | ABC |
| IEEE123_ABC_4 | 0.20 | 0.05 | -0.05 | 0.25 | ABC |
| IEEE123_ABC_2 | 0.10 | 0.03 | -0.03 | 0.12 | ABC |
| IEEE123_ABC_1 | 0.10 | 0.03 | -0.03 | 0.12 | ABC |
| IEEE123_ABC_7 | 0.50 | 0.12 | -0.12 | 0.60 | ABC |
where:
- RATEDS: Maximum apparent rated power capacity
- PMAXDEF: Default maximum active power capacity (i.e., nameplate installed capacity)
- QMAXDEF: Default maximum reactive power capacity
- QMINDEF: Default minimum reactive power capacity
Modeling Scenarios with ENET138
In SAInt, a scenario represents a specific case study applied to a network. A scenario is characterized by its type (e.g., SteadyACPF, SteadyUACPF, or DCUCOPF), a time window (start time, end time) and other time-dependent properties such as time step, time horizon, time look-ahead, and time step look-ahead. It may also include a set of events and profiles. An event denotes a change in settings, controls, or constraints of an object at a specific time during the scenario’s execution. A profile is a sequence of equidistant data points that includes information on how these data points are processed in terms of time step, interpolation, sampling, and periodicity. A profile can be assigned to an event to control the event’s value over time.
Tip
- The scenario profiles can be viewed through SAInt GUI by navigating to the Scenario Tab and selecting [EPRF] button, after loading the network and scenario files.
- To explore the list of events that are part of a scenario, navigate to the Scenario Tab and select [EEVT] after loading the corresponding network and scenario files.
A scenario allows for systematic and repeatable analysis of network behavior under varying conditions. For the ENET138 network, five scenarios have been developed, categorized into three scenario types:
- SteadyUACPF (Steady-state Unbalanced AC power flow)
- QuasiDynamicUACPF (Quasi-dynamic unbalanced AC power flow)
- DCUCOPF (Direct Current Unit Commitment Optimal Power Flow)
UACPF_IEEE123_BASE_RESULTS
This scenario is designed to validate the steady-state unbalanced AC power flow simulation of the ENET138 network by comparing it to the power flow values from the IEEE-123 test system’s .DSS file. Validation is achieved by matching the generation and demand configurations in ENET138 with those of the IEEE-123 test system.
The scenario configures the ENET138 network to replicate the results from the IEEE-123 test system and has the following properties:
- Name: UACPF_IEEE39_BASE_RESULTS
- Type: SteadyUACPF
There are three sets of events included in this scenario:
Active power set point (SAInt Event Parameter: PSET)
This scenario includes 112 active power set point (PSET) events: 95 for demand and 17 for PV generator objects. For distributed PV generators, these events define the active power generation, while for EDEM objects, they specify the active power consumption. Each PSET event’s Value references the object’s PSETDEF property, which defines the default active power set point.
Slack participation factor set point (SAInt Event Parameter: PFSET)
One slack participation factor set point (PFSET) event is applied to the sub-transmission generator (XGEN). This event sets the slack contribution factor by referencing the PFSETDEF property, which defines the default slack participation factor for the generator.
Voltage magnitude set point (SAInt Event Parameter: VMSET)
There are three voltage magnitude set point (VMSET) events: two for voltage-regulating transformers (TRF) and one for the sub-transmission generator (XGEN). The voltage magnitude for XGEN is set by referencing the VMSETDEF property, which specifies the default voltage magnitude in per unit. For the transformers (TRF), a constant voltage magnitude of 1.025 per unit is specified in the event’s Value field.
Tip
In this SteadyUACPF scenario, the default property values already set the appropriate constraints, so adding these events isn’t necessary. However, if you need to change a constraint value, it’s best to do so using scenario events rather than altering the default property at network level. This approach ensures that changes are specific to the scenario and don’t unintentionally affect other scenarios that may not require the same adjustments.
The validation results for this scenario will be available soon!
UACPF_PEAK_DEMAND_WEEK
This scenario performs an AC power flow simulation under unbalanced conditions to evaluate the performance of the ENET138 network during the peak demand week, aligned with the ENET39 peak demand week scenario. It has the following properties:
- Name: UACPF_PEAK_DEMAND_WEEK
- Type: QuasiDynamicUACPF
- StartTime: July 16th, 2023
- EndTime: July 23rd, 2023
- TimeStep: 60 min
This scenario includes the active power set point (PSET) events for both demand and distributed PV generator objects.
Demand
The ENET138 network contains 7 demand objects in the SUBT zone and 88 demand objects in the IEEE123 zone. Two demand profiles, VT_DEMAND_SHAPE and NH_DEMAND_SHAPE, identical to those used in the PEAK_DEMAND_WEEK scenario of ENET39, are applied. These profiles are linked to the EDEM objects through PSET events, which adjust the PSET value at each time step by scaling the demand shape based on the event Value, defined by the object’s PSETDEF property. The PSETDEF property specifies the default active power set point, representing the peak power consumption.
Distributed PV Generator
The ENET138 network also includes 17 distributed PV generator objects in the IEEE123 zone. This scenario uses the PV_VT_PSET_PU solar irradiance profile to model PV generation. This profile is linked to PV objects through PSET events, adjusting the PSET value at each time step by scaling the normalized profile according to the event Value, defined by the object’s PMAXDEF property. The PMAXDEF property sets the default maximum active power, representing the installed capacity.
Results
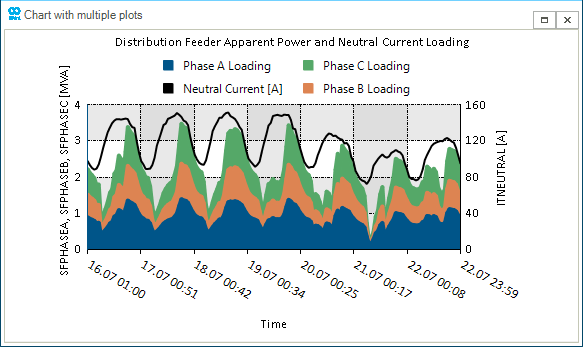
Figure 4 shows the per-phase apparent power flowing into the distribution system, alongside the neutral current of the getaway (the conductor departing from the transformer substations). By visualizing the apparent power across different phases, users can assess how evenly the load is distributed and identify any significant imbalances. The neutral current indicates the extent of this unbalance, helping to pinpoint areas where corrective actions may be necessary to improve system stability and reliability.
Tip
The plot displayed above can be generated using the IronPython script titled “Feeder_Load.ipy,” which can be executed from the Script Editor within the SAInt GUI.
UACPF_PEAK_DEMAND_DAY
This scenario is a subset of the UACPF_PEAK_DEMAND_WEEK aimed to perform an AC power simulation under unbalanced condition during the peak demand day. It has the following properties:
- Name: UACPF_PEAK_DEMAND_DAY
- Type: QuasiDynamicUACPF
- StartTime: July 18th, 2023
- EndTime: July 19th, 2023
- TimeStep: 60 min
The UACPF_PEAK_DEMAND_DAY scenario contains the same set of events and profiles as the UACPF_PEAK_DEMAND_WEEK with the updated event “StartTime” and “PrfStartTime.”
Results
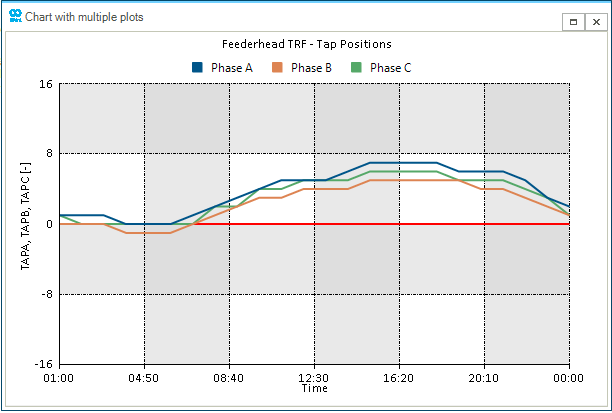
Let’s look at the operation of the tap settings for the step-down transformer SUBT_FEEDER_123 during the peak demand day. Figure 5 below shows the operation of the tap settings for the transformer which connects to the distribution network in the IEEE123 zone.
Tip
The plot displayed above can be generated using the IronPython script titled “Feederhead_Taps.ipy,” which can be executed from the Script Editor within the SAInt GUI.
PCM_PEAK_DEMAND_WEEK
This scenario models a price-taking distribution network, where the price at the source node ENO.SUBT_N1 is determined by the shadow price at node ENO.BRATTLEBORO from the PCM_PEAK_DEMAND_WEEK scenario of the ENET39 network. It has the following properties:
- Name: PCM_PEAK_DEMAND_WEEK
- Type: DCUCOPF
- StartTime: July 16th, 2023
- EndTime: July 23rd, 2023
- TimeStep: 60 min
- TimeHorizon: 24 hrs
- TimeLookAhead: 24 hrs
- TimeStepLookAhead: 60 min
The active power set points (PSET) for all demand and distributed PV generator objects are deterministically defined using the same set of events as in the UACPF_PEAK_DEMAND_WEEK scenario.
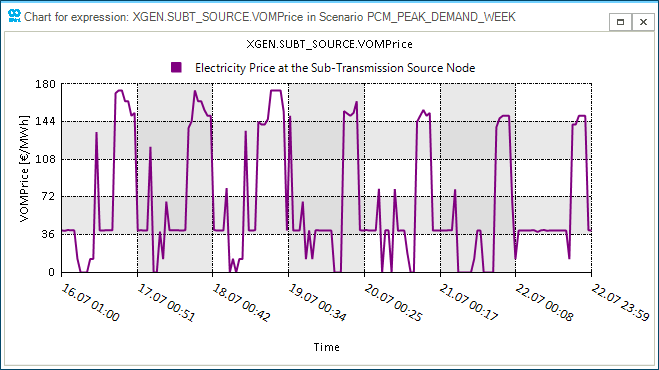
Additionally, the scenario includes a BRATTLEBORO_ENERGY_PRICE profile, which represents the shadow price at node ENO.BRATTLEBORO from the PCM_PEAK_DEMAND_WEEK scenario of the ENET39 network. This profile is linked to the operational cost of the sub-transmission generator using the variable operation and maintenance price event (SAInt Event Parameter: VOMPrice). The event adjusts the VOMPrice of the generator at each time step based on the corresponding data point in the shadow price profile as shown in Figure 6.
At the current load level, there are no system constraints, nor are controllable assets like energy storage systems (ESTR) installed. However, the network is fully equipped for users to observe the impacts of various factors, including increased solar PV penetration, the presence of storage devices, different types of demand and behavior (such as demand response or electric vehicle chargers), and the application of network-driven custom constraints. This network and PCM scenario provide a foundation for users to explore the operation and dispatch of distributed energy resources within a distribution system.
Results
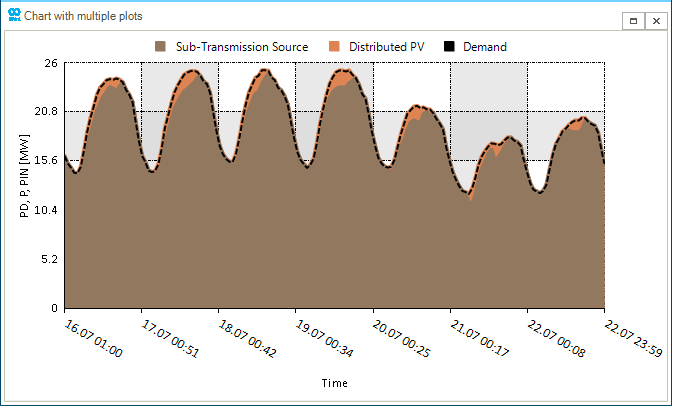
Figure 7 displays the dispatch of the sub-transmission and the distributed PV generators during the peak demand week.
Appendix
Line Length Comparison
The table below shows the line length comparison between the distribution network of ENET138 and the IEEE-123 test system. The line names are listed below without the prefix.
| Line Name | ENET138 [km] | IEEE123 [km] |
|---|---|---|
| L1 | 0.082 | 0.053 |
| L2 | 0.28 | 0.076 |
| L3 | 0.061 | 0.091 |
| L4 | 0.243 | 0.061 |
| L5 | 0.173 | 0.099 |
| L6 | 0.071 | 0.076 |
| L7 | 0.024 | 0.061 |
| L8 | 0.071 | 0.069 |
| L9 | 0.189 | 0.069 |
| L10 | 0.022 | 0.091 |
| L11 | 0.072 | 0.13 |
| L12 | 0.053 | 0.046 |
| L13 | 0.317 | 0.251 |
| L14 | 0.016 | 0.076 |
| L15 | 0.027 | 0.076 |
| L16 | 0.138 | 0.114 |
| L17 | 0.106 | 0.107 |
| L18 | 0.109 | 0.076 |
| L19 | 0.255 | 0.091 |
| L20 | 0.07 | 0.099 |
| L21 | 0.309 | 0.16 |
| L22 | 0.152 | 0.076 |
| L23 | 0.04 | 0.168 |
| L24 | 0.09 | 0.084 |
| L25 | 0.17 | 0.107 |
| L26 | 0.148 | 0.061 |
| L28 | 0.14 | 0.069 |
| L30 | 0.309 | 0.091 |
| L31 | 0.088 | 0.107 |
| L32 | 0.029 | 0.061 |
| L33 | 0.113 | 0.091 |
| L34 | 0.031 | 0.03 |
| L35 | 0.37 | 0.198 |
| L36 | 0.211 | 0.076 |
| L37 | 0.294 | 0.091 |
| L38 | 0.101 | 0.076 |
| L39 | 0.08 | 0.099 |
| L40 | 0.06 | 0.099 |
| L41 | 0.112 | 0.076 |
| L42 | 0.124 | 0.152 |
| L43 | 0.13 | 0.061 |
| L44 | 0.009 | 0.061 |
| L45 | 0.066 | 0.076 |
| L46 | 0.107 | 0.091 |
| L47 | 0.048 | 0.046 |
| L48 | 0.074 | 0.076 |
| L49 | 0.086 | 0.076 |
| L50 | 0.098 | 0.076 |
| L51 | 0.167 | 0.152 |
| L52 | 0.125 | 0.061 |
| L53 | 0.105 | 0.038 |
| L54 | 0.149 | 0.084 |
| L55 | 0.198 | 0.107 |
| L56 | 0.104 | 0.084 |
| L57 | 0.091 | 0.076 |
| L58 | 0.275 | 0.229 |
| L59 | 0.074 | 0.076 |
| L61 | 0.166 | 0.076 |
| L62 | 0.093 | 0.053 |
| L63 | 0.103 | 0.107 |
| L64 | 0.134 | 0.13 |
| L65 | 0.082 | 0.099 |
| L66 | 0.068 | 0.061 |
| L67 | 0.106 | 0.084 |
| L68 | 0.102 | 0.076 |
| L69 | 0.044 | 0.084 |
| L70 | 0.073 | 0.099 |
| L71 | 0.07 | 0.084 |
| L72 | 0.126 | 0.084 |
| L73 | 0.086 | 0.061 |
| L74 | 0.174 | 0.107 |
| L75 | 0.079 | 0.122 |
| L76 | 0.256 | 0.122 |
| L77 | 0.427 | 0.213 |
| L78 | 0.115 | 0.03 |
| L79 | 0.034 | 0.069 |
| L80 | 0.083 | 0.145 |
| L81 | 0.043 | 0.053 |
| L82 | 0.159 | 0.076 |
| L83 | 0.21 | 0.206 |
| L84 | 0.1 | 0.076 |
| L85 | 0.146 | 0.145 |
| L86 | 0.129 | 0.137 |
| L87 | 0.085 | 0.053 |
| L88 | 0.063 | 0.084 |
| L89 | 0.053 | 0.076 |
| L90 | 0.232 | 0.069 |
| L91 | 0.202 | 0.091 |
| L92 | 0.082 | 0.069 |
| L93 | 0.035 | 0.084 |
| L94 | 0.116 | 0.091 |
| L95 | 0.11 | 0.061 |
| L96 | 0.213 | 0.084 |
| L97 | 0.184 | 0.168 |
| L98 | 0.186 | 0.091 |
| L99 | 0.108 | 0.244 |
| L100 | 0.131 | 0.069 |
| L101 | 0.207 | 0.084 |
| L102 | 0.108 | 0.099 |
| L103 | 0.088 | 0.213 |
| L104 | 0.074 | 0.069 |
| L105 | 0.094 | 0.099 |
| L106 | 0.135 | 0.175 |
| L107 | 0.089 | 0.137 |
| L108 | 0.024 | 0.305 |
| L109 | 0.101 | 0.091 |
| L110 | 0.146 | 0.175 |
| L111 | 0.095 | 0.038 |
| L112 | 0.083 | 0.16 |
| L113 | 0.15 | 0.099 |
| L114 | 0.127 | 0.114 |
| L115 | 0.038 | 0.122 |
| L116 | 0.218 | 0.122 |
| L117 | 0.275 | 0.107 |
| L118 | 0.213 | 0.076 |
| SW1 | 0.006 | 0.001 |
| SW2 | 0.02 | 0.001 |
| SW3 | 0.018 | 0.001 |
| SW4 | 0.024 | 0.001 |
| SW5 | 0.018 | 0.001 |
Note
- The line name prefix “F1” has been changed to “IEEE123” in the ENET 138 network.
- The lines F1_L27, F1_L29, F1_L60, and F1_SW6 in the IEEE-123 test system are removed.
